In the darkest regions of deep space, the temperature is a chilly -450° Fahrenheit. Closer to our Sun, temperatures reach thousands of degrees Fahrenheit. What makes Earth’s climate so moderate? Separating Earth from the extreme and inhospitable climate of space is a 500-mile-thick cocoon of gases called the atmosphere.
All planets have an atmosphere, a layer of gases that surrounds them. The Sun’s atmosphere is made up of hydrogen, while Earth’s is made up primarily of nitrogen and oxygen. Carbon dioxide, ozone, and other gases are also present. These gases keep our planet warm and protect us from the direct effects of the Sun’s radiation. Without this regulation, Earth could not sustain life.
Today we will start to learn WHY the earth’s atmosphere is so important to life. We will also discuss the major gases in the atmosphere and learn why each of them is so important.
From here we will then do an online activity called Atmosphere Virtual Lab! You can find this on Google Classroom.
This week we will be watching the movie SUPERVOLCANO as a final salute to geology! It’s a great story about the eruption of the massive volcano underneath Yellowstone National Park. With all you have learned in your geology unit and our park projects, you should really enjoy the movie. Click on the title above to see the movie at home on YouTube.
Ckick HERE to go to the Yellowstone Volcano Observatory Website
Weathering and erosion shape the world that is around us. Watch and listen as Zoe and RJ from the StudyJams Crew explain the science behind weathering and erosion.
Processes at Earth’s surface and heat within Earth cause rocks to change into other types of rocks.
All rock started as magma. The rock cycle started with the cooling of the earth’s magma billions of years ago. But after that, it has no end. Rather, it is an ongoing cycle in which rock — driven by tectonic processes such as volcanoes and earthquakes, the surface processes of weathering and erosion, and compaction — is created and destroyed.
For this assignment, you will go to the following web site:
Open the Interactives Rock Cycle in a different window.
This interactive web site will help you to review the types of rocks and the processes that occur within the rock cycle. Instructions given on the web site will lead you through the different sections of material.
The tutorial will review the three rock families and provide you with a list of key characteristics that can be used to place samples within the three rock families.
In this part of the tutorial, when you click on the rock sample, you will be provided with the name of the rock as well as information on how the rock forms and where it can be found. Make sure to add the rocks to your collection.
The next section, “Identify Rock Types”, will allow you to test your ability to recognize rock characteristics and types. Note: this section is timed (six minutes…more than enough time to complete the activity).
When you have completed this self-test, go on to the next section, which describes How Rocks Change. Be sure to view the animation sequences provided for each rock family!
At the end of this section, complete the self-test Transform the Rock to see if you can identify the processes that can change rocks from type to another.
This self-test is timed (six minutes); to complete the sequence, click and drag your answer into the appropriate box.
The next section describes the rock cycle and also includes a self-test Complete the Rock Cycle to see if you can name the different parts of the rock cycle.
The final activity at the web site is a Test Your Skills assessment to see how much you have learned.
Enter your first and last name in the space provided. When you have completed the assessment, print out your results. Make sure that you print out the complete results. Do not just print your score. You must show your teacher the printout with all of the graded questions to get credit.
This will then become your Study Sheet!
Alternate Assignment:Rocky’s Journey
You are now a well-educated geologic student of The Rock Cycle!
This week we are studying the three processes of Mountain Building. Mountain building is a very slow process that can take many thousands and even millions of years. Over this time many earthquakes will occur, slowing changing the shape of the land to create a mountain in one of three ways:
Folding, creating Folded Mountains
Faulting, creating Fault-Block Mountains
Volcanic Activity – creating a volcano or a dome mountain
Folded mountains are caused by compression stresses and reverse faults, causing a slow uplift of earth’s crust and rocks. These usually occur along plate boundaries where two plates are converging. The process is similar to pushing a carpet lying on a floor up against a wall to form. The Himalayas in Asia, the Alps in Europe, the Andes in South America and the Appalachian Mountains of the US are good examples of Folded Mountains. Interesting national parks would be the Rocky Mountain National Park in Colorado and the Great Smoky Mountains National Parkin Tennessee/North Carolina.Folding of a MountainFault-blockmountains are created where the crust may be stretched apart by tension stresses. Cracks in the Earth’s surface are formed by normal faults, which can result in the formation of fault-blockmountains. If there are two parallel faults, the crustal block between them may either rise to form a fault-block mountain or fall to produce a rift valley. Examples are the Grand Teton National Park in Wyoming and the Great Rift Valley in Africa.Fault-Block Mountain BuildingVolcanic Activity -These mountains form when plate activity allow magma to rise up through the earth’s crust and erupt on the surface. This can create a mountain of lava (magma outside the crust) and ash that can form very tall mountain peaks called volcanoes. The mountain peaks of the Pacific Northwest, such as in Mount Rainier National Park and in North Cascades National Park, as well as Kenai Fjords National Park in Alaska, are examples of volcanic mountains. Volcano BuildingSometimes the magma in the crust simply pushes an area of the crust up into a dome shape. The crust doesn’t snap and break, but rather it swells upward as a bump on the crust’s surface. This is called a Dome Mountain. Examples of these would be Yosemite National Park in California and the Adirondacks of New York.Dome Building
Click on the picture below to see an animation of how a seismograph works.
What shakes, and what doesn’t?
Click on the picture below to see
HOW TO FIND THE EPICENTER of an EARTHQUAKE
THIS WEEK’S LESSON
Earthquakes are a form of wave energy that is transferred through the crust. Motion is transmitted from the point of sudden energy release, the focus, as seismic waves that travel in all directions outward. The point on the Earth’s surface directly above the focus is termed the epicenter.
SEISMIC WAVES AND THE SLINKY
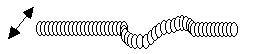
P-waves or primary waves are formed by the alternating compression and expansion of the crust. They are the first to arrive at a seismograph station, and travel in a straight line. Think of the slinky we did in class!P-waves also have the ability to travel through solid, liquid, and gaseous materials.
S-waves or secondary waves are formed by the side-to-side movement of the crust. They are the second to arrive at a seismograph station, and travel more slowly. Think again of the side-to-side slinky we did in class, or look at the example below.
S-waves have the ability to travel through solids, but stop at liquid and gaseous materials.
What does that mean as the waves travel through the earth’s layers?
What happens at the Outer Core?
What does this help geologists to know about the Outer Core?
Surface waves are something like the waves in a body of water — they move the surface of the earth up and down. This generally causes the worst damage because the wave motion rocks the foundations of manmade structures. Surface waves are the slowest moving of all waves, so the most intense shaking usually comes at the end of an earthquake.
1. Go to the USGS – Earthquake Center Website, this shows all the activity for the past 7 days. Find yesterday’s earthquake data.Click on the map above, or the link above, to open that web site.
2. Choose 3 different earthquake locations, with magnitudes of 3.0 or higher, and plot them on the map provided using a colored pencil.
3. Each date will be a different color, for example 11/24/16= red, 11/25/16= blue, etc… On your map, create a key to indicate when those earthquakes occurred.
4. Continue until you have 5 days plotted on your map (25 data points total).
You will find the earthquakes for each day this week, record the earthquake data, and then plot the location of the earthquake on the map you received in class. By the end of the week you will have all 5 charts completed.
We will use the information from the chart, and what we had discussed in class, for a WORM activity on Monday, December 12.
If you cannot find your map, click on the map below for another copy.
If you cannot find your worksheet, click here for another copy.
You may also use an APP that you find for your Smart Phone or Tablet. Look for “Earthquakes” apps that provide real time data.
Have Fun!
Alternate Assignment:
Click on the picture below to take you to
My Schoolhouse.
Read the article and complete the answers on the screen.
Keep trying until you get 8/8 correct!
When you get them all correct, print out the page that looks like the picture below, or complete the worksheet from class.
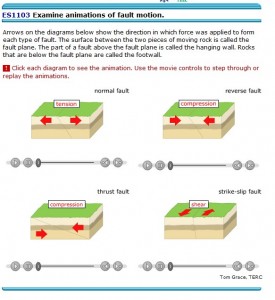
In class this week we will look at the movement of the Earth’s crust along a crack in the crust called a fault. The earth slips, slides or drops along these faults depending on the stress involved, and the direction of movement. We discussed three types of stress – tension, compressionand shearing.
REMEMBER
PLOTTING EARTHQUAKES
WORM NEXT WEEK!
Click on the picture above to see the animations of the Fault Motions. Think and answer the following questions:
Along what type of plate boundary might you find COMPRESSION stress? _________________
Along what type of plate boundary might you find TENSION stress?
_________________
Along what type of plate boundary might you find SHEARING stress? _________________
Watch the video above on Earthquake Destruction. There are several ideas and concepts that are presented for which you should be taking notes.
List two things you learned in the film.
The film talks about earthquakes being ‘a creative force’.
What does the narrator mean by this?
Explain this comment.
STRESSES AND FAULTS
We are also looking at the relationships between Plate Movement, Stress and Types of Faults we find on the earth. These faults cause the ground to move in different ways during an earthquake. Click on the animation below to see how these stresses and faults are related.
(Credit to Mr. Parr – creator of many YouTube Videos for students)
Convection Currents in the Earth
As we were studying Continental Drift, we learned that although Alfred Wegener had a great theory, he was not able to explain HOW the continents moved. About 60 years later geologists started to look at the ocean floor, and they discovered that the ocean had a very long range of mountains which they called the Mid-Ocean Ridge. Scientists also learned more about what was happening in the mantle, and found that the heat of the core was creating Convection Currents n the mantle.
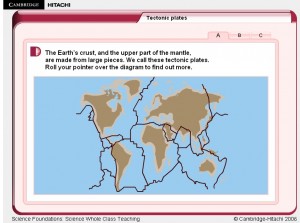
The tectonic plates rest on the asthenosphere, a layer of soft rock. Rock in the asthenosphere and in the rest of the mantle moves from convection.
Convection is energy transfer by movement of a material. Heat causes material to become less dense – it then rises, cools, becomes denser and then sinks, only to repeat again. In a pot of boiling water, the water gets heated at the bottom, rises to the top, cools when it hits the air, and then sinks again, forming a looped current.
Click on the picture to see the animation.
The core of the earth makes the heat. It causes the molten material in the mantle to rise, cool and then sink back to the center, where it gets heated again. Notice how the convection currents in the earth are all around the mantle, heated by the core.
The lithosphere is broken into tectonic plates, and these float on the asthenosphere. As the convection currents flow, the floating plates also move, very slowly, about an inch a year. This is what caused the continents to move! Look closely at the diagram, and then clink on the link below to see the movement.
As you can see by the animation, the convection currents in the mantle make the plates in the lithosphere move. Some of them move together to collide at a CONVERGENT BOUNDARY to form mountains, and some of them move apart at a DIVERGENT BOUNDARY to form cracks in the crust. Magma comes up through these cracks, creating a Mid-Ocean Ridge on the sea floor.
Click on the link below to see how new ocean crust is being made at the Mid-ocean Ridge, and that the new crust is pushing the older crust away. The farther you go from the ridge, the older the crust is. This is one way that scientists can prove that the plates are actually moving!
Click on the picture above to see the animation.
In class we then took notes on the Smartboard to review the convection currents in the mantle, their effect on the plates of the lithosphere, and we had an introduction to DIVERGENT and CONVERGENT boundaries. The plates move because of the convection currents in the asthenosphere (mantle) forcing the plates to flow with the current.
We ended last week with a review of the layers of the earth, and used diagrams on the SmartBoard to identify the various layers and their key features. Below are the screen captures of the SmartBoard activity for those of you that missed the class. We also discussed the two type of crust, CONTINENTAL and OCEANIC, and the characteristics of each. Continental crust is much thicker than the oceanic crust, and is made of GRANITE. Ocean crust is thin, much denser, which is why it is lower on the earth’s surface, and is made of BASALT rock.
This week we begin a discussion of the evidence that geologist Alfred Wegener developed to support the Theory of Continental Drift – that all the continents were at one time connected into one large land mass called Pangaea. We made cut-out maps of Pangaea and then identified where Wegener discovered similar fossils, land formations, (such as mountains) and evidence of climate changes in glacial scratches and areas of coal. We drew them on the SmartBoard diagrams and colored the areas where he found his evidence. Unfortunately, Wegener was not able to convince the scientists of his day that the continents had actually moved! See the diagram below for the three main pieces of evidence that Wegener used to develop his theory.
Why did not scientists believe that the continents had moved?
What was missing from Alfred Wegener’s Theory of Continental Drift?
What was the missing piece?
An animation of the breakup of Pangaea to form the world we know today!
Enjoy this Music video from Mr. Parr,
a Science teacher who loves music!
CRUST in PIECES
To see a video of the changing earth continents and shapes, click here


 Announcement: